
Essar Ports Posts Record Cargo Growth Of 20.07 Percent In H1FY20

GE’s Electric Technology Powers The World’s Largest Crane Vessel ‘Sleipnir’
October 23, 2019
Saildrone Completes World’s First Unmanned-Autonomous East-To-West Crossing Of Atlantic Ocean
October 23, 2019

Essar’s Ports business, which operates four terminals on the east and west coasts of India, has registered a 20.07% growth in cargo volumes with a throughput of 27.29 Million Tonnes (MT) in the first half of FY2019-20.
The growth has been driven by a 183.21% increase in third-party cargo compared to that in the corresponding period in the previous financial year. Cargo from captive customers grew by 6%.
| H1FY20 (in MT) | H1FY19 (in MT) | Growth | |
| Overall cargo | 27.29 | 22.73 | 20.07% |
| Captive cargo | 20.24 | 19.10 | 6.00% |
| Third-party cargo | 7.05 | 2.49 | 183.21% |
Speaking on the performance, Mr Rajiv Agarwal, MD & CEO, Essar Ports Ltd, said: “Significant boost in third-party business has been the key driver for our growth in overall volumes. Alongside this, our focus on driving operational efficiencies and minimising operating costs has helped in recording strong growth. Essar Ports has consistently surpassed the average growth rate of the sector, which is showing signs of heightened economic activity.”
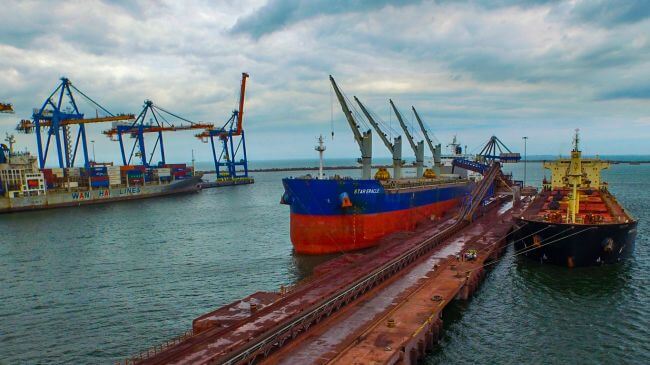
Image Credit: essarports.com
Terminal-wise performance
Hazira
The 50 MTPA terminal has had the following highlights:
- Cargo handling of 14.17 MT with 3.24% growth compared to the same period last year
- 24.46% growth in third-party business over the numbers in H1FY19
- Enhanced third-party cargo share to 16.16%
| H1FY20 (in MT) | H1FY19 (in MT) | Growth | |
| Overall cargo | 14.17 | 13.72 | 3.24% |
| Captive cargo | 11.88 | 11.88 | – |
| Third-party cargo | 2.29 | 1.84 | 24.46% |
Vizag
The 24 MTPA Essar Vizag Terminal (EVTL), India’s largest iron ore handling terminal located on the outer harbour of Visakhapatnam Port, has had the following highlights:
- Cargo handling of 5.91 MT with 52.22% overall growth compared to same period last year
- 7.17% growth in anchor customer business
- 277.76% growth in third-party business over the numbers in H1 FY19
- Enhanced third-party cargo share to 41.62%
| H1FY20 (in MT) | H1FY19 (in MT) | Growth | |
| Overall cargo | 5.91 | 3.88 | 52.22% |
| Captive cargo | 3.45 | 3.22 | 7.17% |
| Third-party cargo | 2.46 | 0.65 | 277.76% |
Salaya
The 20 MTPA Essar Bulk Terminal Salaya (EBTSL), deepest draft facility of Saurashtra region, has clocked a cargo throughput of 3.22 MT in the first half of FY20.
| H1FY20 (in MT) | H1FY19 (in MT) | Growth | |
| Overall cargo | 3.22 | 1.13 | 184.96% |
| Captive cargo | 0.91 | – | – |
| Third-party cargo | 2.31 | 1.13 | 104.11% |
Paradip
The 16 MTPA Essar Bulk Terminal Paradip (EBTPL), in Paradip Port, has clocked a cargo throughput of 4 MT in the first half of FY20.
| H1FY20 (in MT) | H1FY19 (in MT) | Growth | |
| Overall cargo | 4.0 | 4.0 | – |
| Captive cargo | 4.0 | 4.0 | – |
| Third-party cargo | – | – | – |
Reference: essarports.com
Source: Maritime Shipping News